Gather comprehensive data about item usage and average costs within your account. Project into the future or dig into the past!
Under the 'Reports' section of the main menu, you'll find the 'Item Analytics' report allowing you to run queries on date ranges or specific items to view their historical usage and average costs, as well as expected cost and usage in the future. There are three reports in this area: the 'Item Usage' and 'Item Usage Over Time' reports, and the 'Usage Graphs. The default view is the 'Item Usage' report.
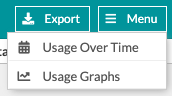
To navigate between the three views, click the 'Menu' button in the top-right corner. The current view will not be displayed.
Item Usage
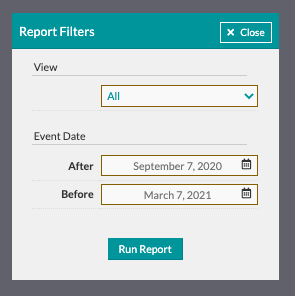
This report displays usage and cost data. To run the report, select a view date range from the default screen and click 'Run Report'.
- View: Select which item category to include in the report.
- Event Date: Select a date range to query for the report. This will always default to today's date and the date six months in the future.
Once you've run the report, you'll see a series of columns displaying the applicable information to your report.
- Item Name: The item name will be displayed in this column.
- Total Stems: The total number of each item used. Though it says 'stems' it will also include rental items.
- Total Events: The total number of events using each particular item.
Important note for the following four columns listed: As a rule, estimated costs are sourced from worksheets and actual costs are sourced from cost sheets.
- Average Estimated Cost: This average is sourced from estimated costs entered on the worksheet within your account.
- Average Actual Cost: This average is sourced from the amounts entered on the cost sheet within your account.
- Average Details Estimated Cost: If this item is a partner-managed item (i.e. it's from the Accent Decor collection) then it will have an average estimated cost sourced from every worksheet in the Details platform.
- Average Details Actual Cost: For partner-managed items, there will also be an average estimated cost sourced from every cost sheet in the Details platform.
Exporting
To export a report, click the 'Export' button in the top-right of the page.
Running a New Report
To start over with a new report, click the 'New Report' button in the top-center of the page. Then, follow the first set of instructions to select parameters and generate the report.

Usage Over Time
This report will display usage in order of which week specific items are being used during. It will default to the view and date parameters selected from the 'Item Usage' view, but you can start over with new parameters by clicking the 'New Report' button in the top-center of the page.
Once you've run the report, you'll see a series of columns displaying the applicable information to your report.
- Week Starting: This column displays which week an item is being used. The report will be displayed in the order of most recent to furthest out.
- Item Name: The item name will be displayed in this column.
- Total Stems: The total number of each item used. Though it says 'stems' it will also include rental items.
- Total Events: The total number of events using each particular item.
Exporting
To export a report, click the 'Export' button in the top-right of the page.
Usage Graphs
Select up to 10 items to view in a graphic report of your choosing. It will default to the view and date parameters selected from the 'Item Usage' view, but you'll need to select the items to include in the graph.
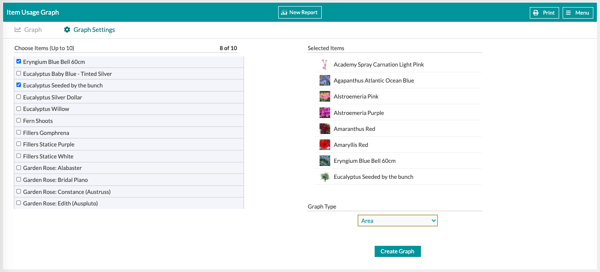
To get started, make the following selections:
- Choose Items: Use the menu on the left to check the box for items to be included in the graph. Keep in mind that this menu will include the items applicable to your selected view for the report. The 'View' is selected in the module used to run new reports where item categories are selected. Choose up to 10 items.
- Graph Type: Use the drop-down menu to select the type of graph you'd like to display the item data in. The options are Area, Stepped Area, Stacked Stepped Area, Column, Stacked Column, Scatter, and Line graphs.
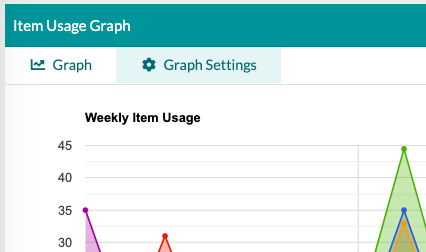
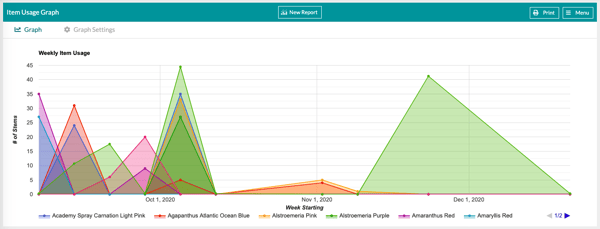
Once you've made the desired selections, click the 'Create Graph' button. All reports will have the 'Total Stems' data included on one axis, with the 'Week Starting' data on the other axis.
Printing
Graphs can be printed by clicking the 'Print' button in the top-right corner of the page.

New Reports & Graphs
To start with a new set of view and date parameters, click the 'New Report' button in the top-center of the page.
To create new views of the graph with the same set of view and date parameters, click the 'Graph Settings' tab in the top-left of the graph. Select new items and graph types, then click 'Create Graph'