---
title: "The Client Portal: Analytics"
description: View when your clients are accessing the client portal, what pages they are visiting, and even if they are viewing it right now!
---
[Skip to content](https://support.detailsflowers.com/en/the-client-portal-analytics#main-content)

- Details University
Show submenu for Details University
- [Video Tutorials](https://info.detailsflowers.com/video-tutorials)
- [15-Minute Meeting](https://meetings.hubspot.com/details-flowers/meet-with-details-support-free)
- [Details Check-In](https://meetings.hubspot.com/details-flowers/details-check-in-50)
- [Details University I](https://meetings.hubspot.com/details-flowers/details-university-i-50)
- [Details University II](https://meetings.hubspot.com/details-flowers/details-university-ii-75)
- [New Employee Orientation](https://meetings.hubspot.com/details-flowers/new-employee-orientation-50)
- Community
Show submenu for Community
- [Join Our FB Group](https://www.facebook.com/groups/detailsflowers)
- [\[Sign In\]](https://details.flowers/)
Open main navigation
Close main navigation
- Details University
Show submenu for Details University
- [Video Tutorials](https://info.detailsflowers.com/video-tutorials)
- [15-Minute Meeting](https://meetings.hubspot.com/details-flowers/meet-with-details-support-free)
- [Details Check-In](https://meetings.hubspot.com/details-flowers/details-check-in-50)
- [Details University I](https://meetings.hubspot.com/details-flowers/details-university-i-50)
- [Details University II](https://meetings.hubspot.com/details-flowers/details-university-ii-75)
- [New Employee Orientation](https://meetings.hubspot.com/details-flowers/new-employee-orientation-50)
- Community
Show submenu for Community
- [Join Our FB Group](https://www.facebook.com/groups/detailsflowers)
- [\[Sign In\]](https://details.flowers/)
- [Email Us](mailto:support@detailsflowers.com)
[Email Us](mailto:support@detailsflowers.com)
Welcome to the Details Knowledge Base! How can we help you?
- There are no suggestions because the search field is empty.
1. [Details Flowers Knowledge Base](https://support.detailsflowers.com/en?hsLang=en)
2. [Education & Learning](https://support.detailsflowers.com/en/education-learning?hsLang=en)
3. [Client Portal](https://support.detailsflowers.com/en/education-learning?hsLang=en#client-portal)
# The Client Portal: Analytics
## View when your clients are accessing the client portal, what pages they are visiting, and even if they are viewing it right now!
The Details Analytics page will allow you to see what users accessed your client portal, how long they viewed the page, whether they are currently looking at it, and more. To access this page, go to the Main Menu and select 'Client Portal'\>'Client Portal Analytics' from the available options.
On the left-hand side of the page, you will be able to filter your Analytics by Users, Sessions, or Pages in the 'View' drop-down menu. You will have slightly different fields below depending on which option you choose here.

### Filters
- **Users**
Each time a client accesses the client portal from any page, their interaction is tracked. This section will allow you to view those analytics by a specific User, Client, Status, or Event.
From there, you can select if you want to filter by a specific page or date range. If no other filters are selected, it will show all users for all time.

- **Sessions**
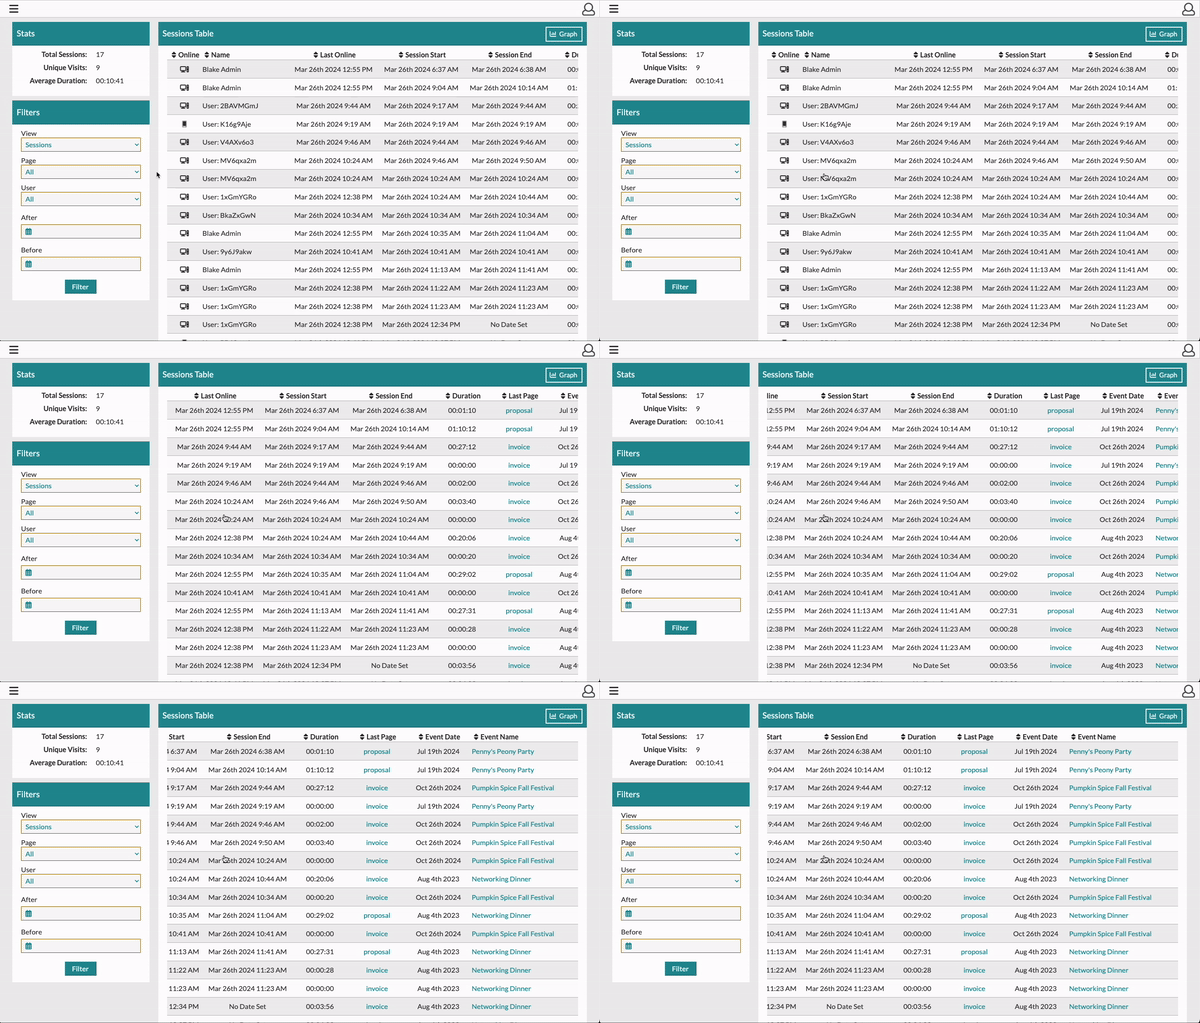
For each session on the Client Portal, you will receive analytics regarding the length of that session, the user in the session, what page the session occurred on, and more.
You can add additional filters to view sessions on a specific page or by a specific user and adjust the date range of sessions you wish to see.
- **Pages**
On each page, analytics are tracked for each user who accesses one or multiple pages within the Client Portal. This section can be filtered down by user or date range.

On the left side of each name, you will see either a mobile phone or a desktop computer icon, showing what device was used to access the portal. When this icon is green, the user is actively viewing the client portal. If the icon is black, they are not actively looking at the client portal, and if it is green, the user is actively viewing it.
### Graphs
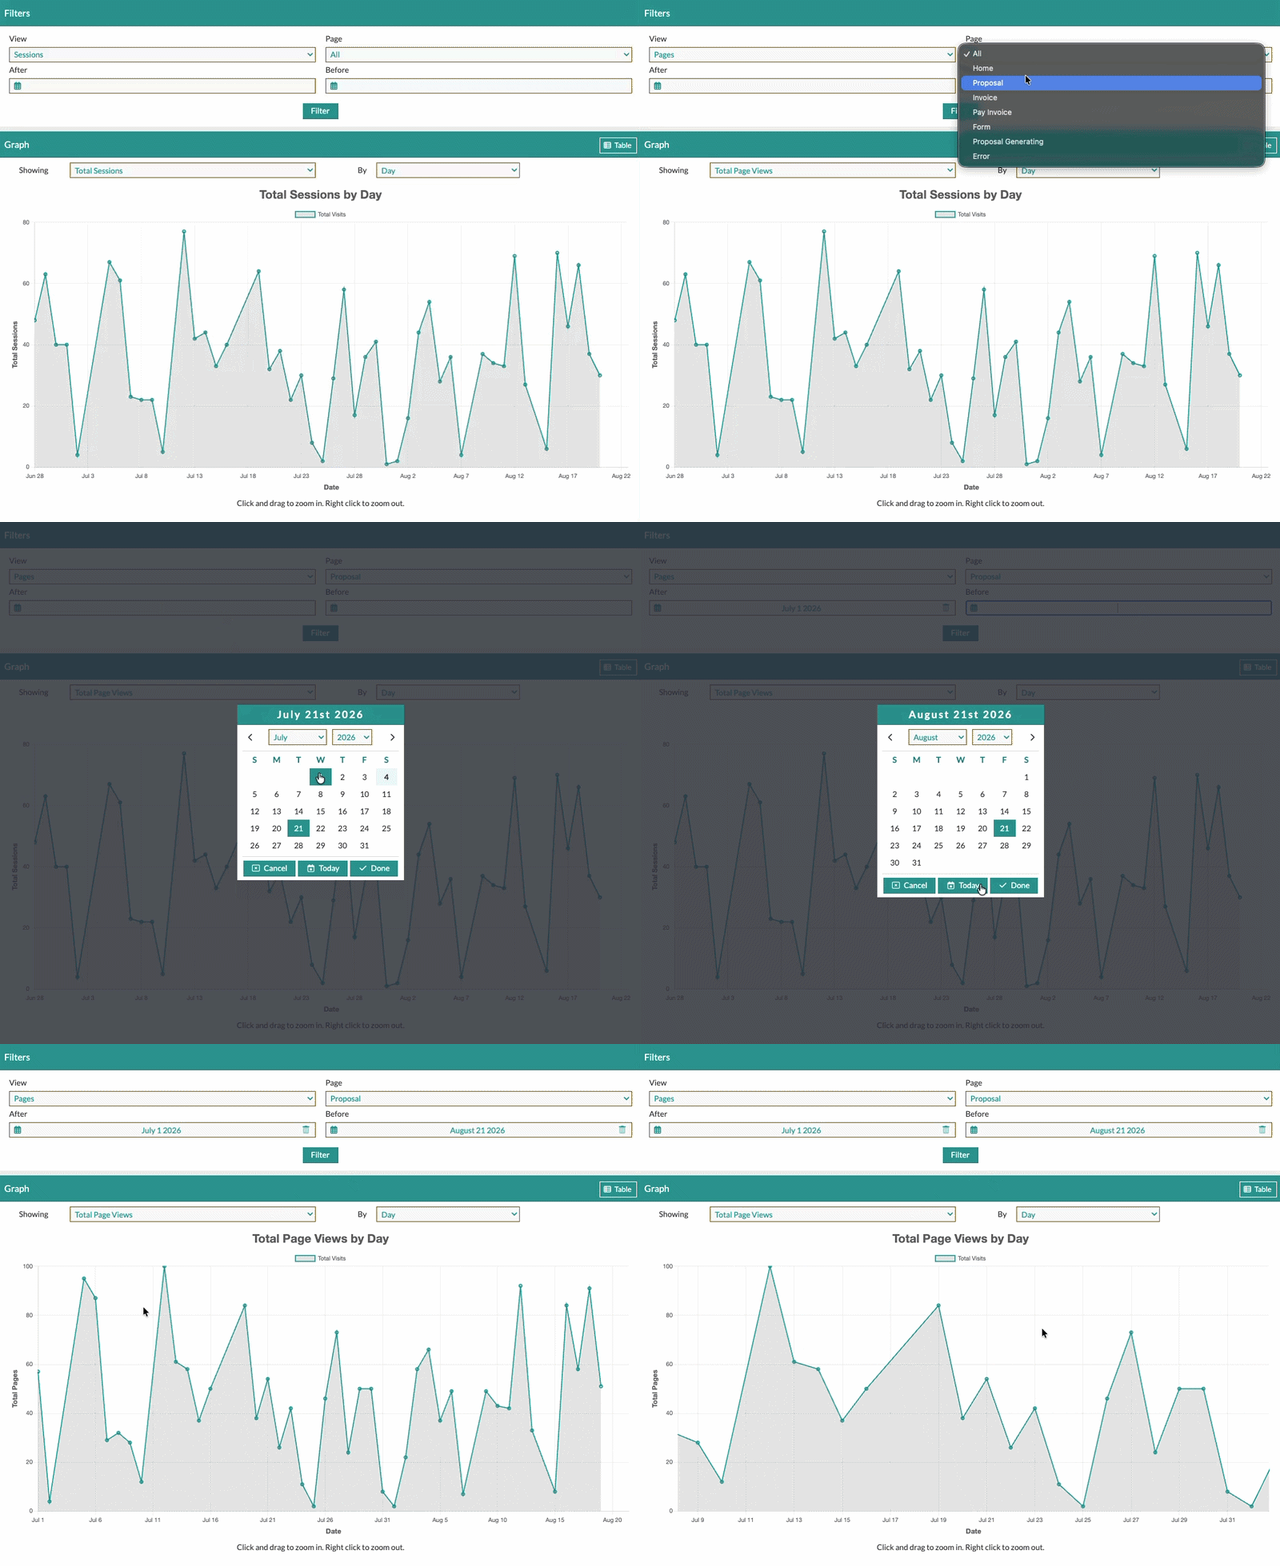
Each set of data can be viewed in the form of a graph. The graph options are based on the information you are viewing at the time and will be presented in a line graph. This data can be shown in days, weeks, months, or years. Click and drag on the graph to narrow your view to a specific range.
### Stats

On the top-left-hand side of the Analytics page, you will have your Stats. This will show you data based on your current filters.
- Users - This will show the total users
- Sessions - When filtering by sessions, you will see the total sessions, total unique visits, and the average time spent on your client portal.
- Pages - When filtering by pages, you will see the total page views and the average time spent on your client portal
- [Getting Started With Details](https://support.detailsflowers.com/en/getting-started-with-details?hsLang=en#main-content)
- [Account Set Up](https://support.detailsflowers.com/en/getting-started-with-details?hsLang=en#account-set-up)
- [Education & Learning](https://support.detailsflowers.com/en/education-learning?hsLang=en#main-content)
- [Supporting Documents](https://support.detailsflowers.com/en/education-learning?hsLang=en#supporting-documents)
- [Event Financials/Invoicing](https://support.detailsflowers.com/en/education-learning?hsLang=en#event-financials-invoicing)
- [Event Details](https://support.detailsflowers.com/en/education-learning?hsLang=en#event-details)
- [Reports](https://support.detailsflowers.com/en/education-learning?hsLang=en#reports)
- [Form Builder](https://support.detailsflowers.com/en/education-learning?hsLang=en#form-builder)
- [Resource Galleries (Inspiration, Recipe, and Item)](https://support.detailsflowers.com/en/education-learning?hsLang=en#resource-galleries-inspiration-recipe-and-item)
- [The Proposal](https://support.detailsflowers.com/en/education-learning?hsLang=en#the-proposal)
- [Costs/RFQ](https://support.detailsflowers.com/en/education-learning?hsLang=en#costs-rfq)
- [The Event List](https://support.detailsflowers.com/en/education-learning?hsLang=en#the-event-list)
- [Client Information](https://support.detailsflowers.com/en/education-learning?hsLang=en#client-information)
- [The Design Board](https://support.detailsflowers.com/en/education-learning?hsLang=en#the-design-board)
- [Tools/Features](https://support.detailsflowers.com/en/education-learning?hsLang=en#tools-features)
- [The Design Worksheet & Recipes](https://support.detailsflowers.com/en/education-learning?hsLang=en#the-design-worksheet-recipes)
- [Company Settings](https://support.detailsflowers.com/en/education-learning?hsLang=en#company-settings)
- [Client Portal](https://support.detailsflowers.com/en/education-learning?hsLang=en#client-portal)
- [Emails](https://support.detailsflowers.com/en/emails?hsLang=en)
- [Details Direct](https://support.detailsflowers.com/en/details-direct?hsLang=en)
- [Account Information](https://support.detailsflowers.com/en/account-information?hsLang=en#main-content)
- [Analytics & Reports](https://support.detailsflowers.com/en/account-information?hsLang=en#analytics-reports)
- [Billing & Subscription](https://support.detailsflowers.com/en/account-information?hsLang=en#billing-subscription)
- [General Account Information](https://support.detailsflowers.com/en/account-information?hsLang=en#general-account-information)
- [Support](https://support.detailsflowers.com/en/account-information?hsLang=en#support)
- [Zapier](https://support.detailsflowers.com/en/zapier?hsLang=en#main-content)
- [Financials](https://support.detailsflowers.com/en/zapier?hsLang=en#financials)
- [About Zapier](https://support.detailsflowers.com/en/zapier?hsLang=en#about-zapier)
- [Project/Task Applications](https://support.detailsflowers.com/en/zapier?hsLang=en#project-task-applications)
- [Calendar Applications](https://support.detailsflowers.com/en/zapier?hsLang=en#calendar-applications)
- [Troubleshooting](https://support.detailsflowers.com/en/troubleshooting?hsLang=en#main-content)
- [The Worksheet](https://support.detailsflowers.com/en/troubleshooting?hsLang=en#the-worksheet)
- [Costs/RFQ/Orders](https://support.detailsflowers.com/en/troubleshooting?hsLang=en#costs-rfq-orders)
- [The Event List](https://support.detailsflowers.com/en/troubleshooting?hsLang=en#the-event-list)
- [Payments/Invoicing](https://support.detailsflowers.com/en/troubleshooting?hsLang=en#payments-invoicing)
- [General](https://support.detailsflowers.com/en/troubleshooting?hsLang=en#general)
- [The Proposal](https://support.detailsflowers.com/en/troubleshooting?hsLang=en#the-proposal)
- [The Resources](https://support.detailsflowers.com/en/troubleshooting?hsLang=en#the-resources)
- [Videos](https://support.detailsflowers.com/en/videos?hsLang=en#main-content)
- [Ordering & Invoicing](https://support.detailsflowers.com/en/videos?hsLang=en#ordering-invoicing)
- [Resource Galleries](https://support.detailsflowers.com/en/videos?hsLang=en#resource-galleries)
- [Creating Events](https://support.detailsflowers.com/en/videos?hsLang=en#creating-events)
- [Useful Features](https://support.detailsflowers.com/en/videos?hsLang=en#useful-features)
- About
- [Home](https://detailsflowers.com/)
- [Details Direct](https://info.detailsflowers.com/details-direct)
- [About Us](https://detailsflowers.com/about)
- [Features](https://info.detailsflowers.com/features)
- [Plans & Pricing](https://info.detailsflowers.com/plans)
- [Testimonials](https://info.detailsflowers.com/testimonials)
- [Press](https://info.detailsflowers.com/press)
- [Media](https://info.detailsflowers.com/media)
- Details University
- [Listen on Spotify](https://info.detailsflowers.com/masterclasses)
- [Classes](https://info.detailsflowers.com/details-university)
- [Demo](https://meetings.hubspot.com/details-flowers/demo)
- [FAQs](https://info.detailsflowers.com/faqs)
- [Careers](https://info.detailsflowers.com/careers-0)
- [Internships](https://info.detailsflowers.com/internships)
- Community
- [Blog](https://blog.detailsflowers.com/blog)
- [Our Partners](https://info.detailsflowers.com/partners)
- [Become a Partner](https://info.detailsflowers.com/become-a-partner)
- [Join Our FB Group](https://www.facebook.com/groups/detailsflowers/)
- Members
- [User Agreement](https://info.detailsflowers.com/user_agreement)
- [Privacy Policy](https://info.detailsflowers.com/privacy_policy)
- [Newsletter Sign Up](https://share.hsforms.com/11p2kVvqiRxSfZcPttN6mTw21epl)
- [Update Email Preferences](https://info.detailsflowers.com/resubscribe-to-important-updates)
[](https://info.detailsflowers.com/?hsLang=en)

**Details is a platform that helps florists and designers do more and earn more. Our software streamlines proposals, ensures clients are profitable down to each arrangement, and simplifies the payment process. Suppliers benefit too, with additional business from in-network florists, volume predictability, and greater customer loyalty.**
**[](https://www.facebook.com/detailsflowers) [](https://www.instagram.com/detailsflowers/) [](https://www.youtube.com/@Detailsflowers) [](https://www.linkedin.com/company/10633597/)[](https://www.tiktok.com/@details.flowers.software)**
- About
- [Home](https://detailsflowers.com)
- [Details Direct](https://info.detailsflowers.com/details-direct?hsLang=en)
- [About Us](https://detailsflowers.com/about)
- [Features](https://info.detailsflowers.com/features?hsLang=en)
- [Plans & Pricing](https://info.detailsflowers.com/plans?hsLang=en)
- [Testimonials](https://info.detailsflowers.com/testimonials?hsLang=en)
- [Press](https://info.detailsflowers.com/press?hsLang=en)
- [Media](https://info.detailsflowers.com/media?hsLang=en)
- Details University
- [Listen on Spotify](https://info.detailsflowers.com/masterclasses?hsLang=en)
- [Classes](https://info.detailsflowers.com/details-university?hsLang=en)
- [Demo](https://meetings.hubspot.com/details-flowers/demo)
- [FAQs](https://info.detailsflowers.com/faqs?hsLang=en)
- [Careers](https://info.detailsflowers.com/careers-0?hsLang=en)
- [Internships](https://info.detailsflowers.com/internships?hsLang=en)
- Community
- [Blog](https://blog.detailsflowers.com/blog?hsLang=en)
- [Our Partners](https://info.detailsflowers.com/partners?hsLang=en)
- [Become a Partner](https://info.detailsflowers.com/become-a-partner?hsLang=en)
- [Join Our FB Group](https://www.facebook.com/groups/detailsflowers/)
- Members
- [User Agreement](https://info.detailsflowers.com/user_agreement?hsLang=en)
- [Privacy Policy](https://info.detailsflowers.com/privacy_policy?hsLang=en)
- [Newsletter Sign Up](https://share.hsforms.com/11p2kVvqiRxSfZcPttN6mTw21epl)
- [Update Email Preferences](https://info.detailsflowers.com/resubscribe-to-important-updates?hsLang=en)
Contact Us
[hello@detailsflowers.com](mailto:hello@detailsflowers.com)
386.255.9594
307 W. Granada Blvd. Suite 2010
Ormond Beach, FL 32174
[Schedule An Intro Call](https://calendly.com/the-details-sales-team/introductory-call-15-minutes)